Hello there.
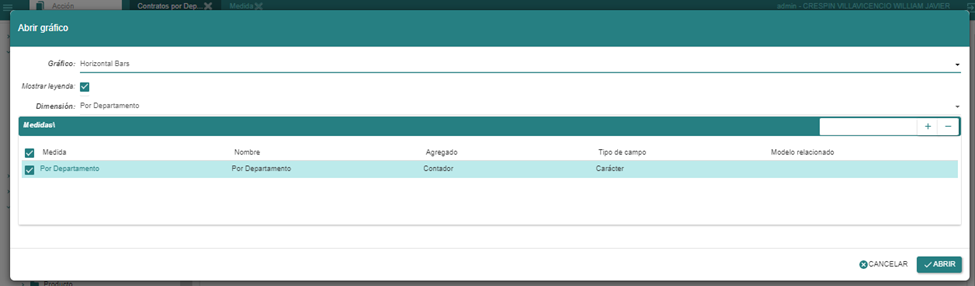
We are facing an issue with visualizing report graphs in the babi module. When we select any of the options such as horizontal bars, vertical bars, or circular bars, nothing is displayed. The following image shows the result when trying to graph:
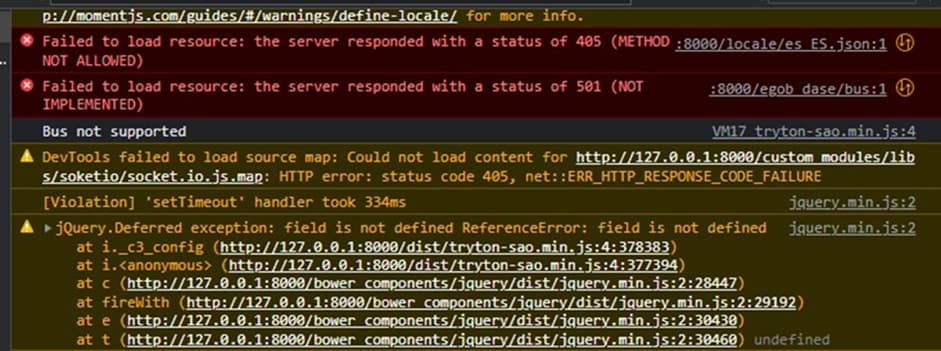
Additionally, upon inspecting the browser console, the following error is shown:
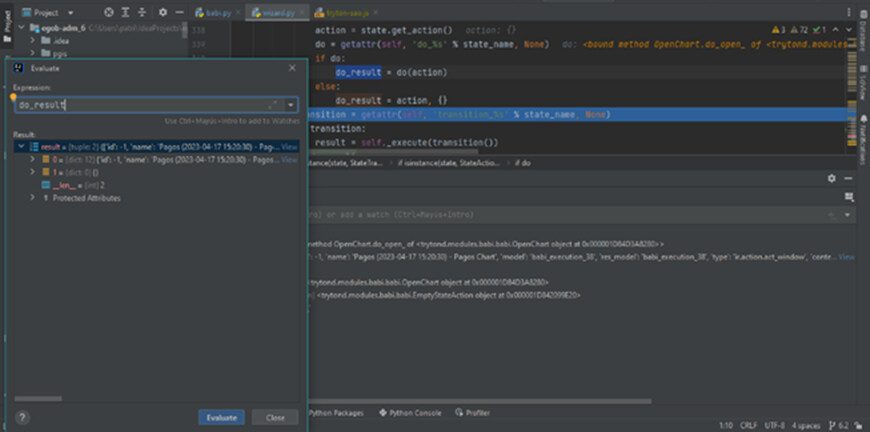
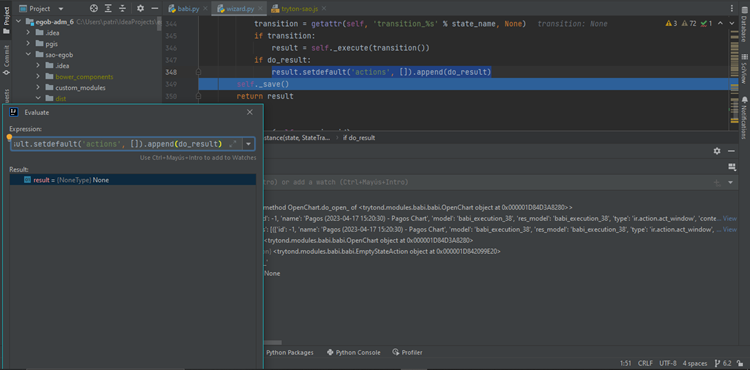
We are using version 6.4 of the babi module and after debugging, we have found that the variable ‘do_result’ in wizard.py does contain records.
Also, if we evaluate the value assigned to “transition”, we can see that it returns None, causing it not to enter the “if” statement below.
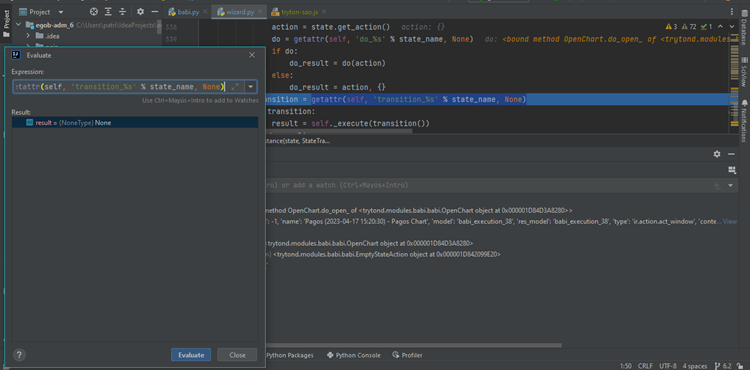
Without entering the first “if” statement because “transition” is empty, entering the next statement will also result in an empty result.
We kindly request your assistance in resolving this issue.
Thank you.