Hello ! I’m trying to create a custom module with a generated custom report.
I wonder if it is possible to create a chart with the data gathered in the placeholders of the template ?
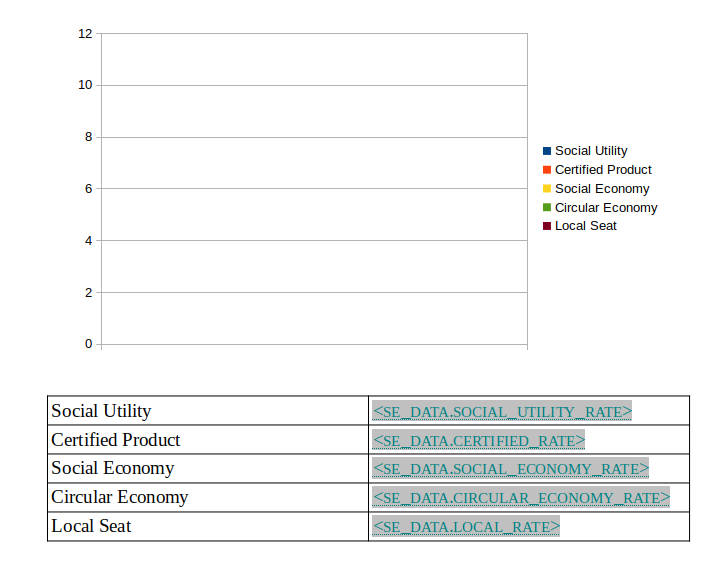
I tried to create a table with the data I wanted to display in my chart, then I created a chart using the data from the table. In the generated report, the chart stays blank, whereas the table has been filled with the expected data.
Here is a capture of my template :
I guess you mean that you embedded a spreadsheet inside a document.
I never try to make a graph out of templated data but relatorio has an example of pivot table. This example requires to refresh the pivot with libreoffice. I guess the same problem exist with graph.
We do not find yet a way to force the refresh automatically when opening.
This is mainly inserting image. It will be better to have the data in the document this case.
Actually, my only goal is to generate a graph using data from the ERP and to make this graph appear in my custom report. I thought that the good way to do it would be to generate the graph directly in the template. But I guess I’m okay with pokoli’s solution and the example of the relatorio documentation
But I have no idea of how to integrate these scripts in a Tryton module…
You may not need to use the relatorio templating to generate the image. It is probably simpler to just generate the image in plain Python inside a method of the report.
Also instead of using a document report, you could use a graph view of the data to display in the client.
The user can then save the graph in an image file.